
Email Marketing Insights in 2025 from Neil Patel
Neil Patel recently shared powerful tips on email marketing success—think cleaner lists, smarter personalization, and value-packed content. His key message? Email isn’t dead; it’s evolving.

The ‘Paid & Organic Report’ is a report found within AdWords and is extremely useful in helping us understand the interaction between AdWords and organic traffic. What happens to one type of listing when another is shown with it. This is relevant to those working in SEO as well as those of you running AdWords accounts.
May 2018 Update: We've created a video version of this guide here
One of the most common questions I am asked from my clients is “Why should I bid on my brand keywords with AdWords? For a branded search I rank number 1, so even without an ad, a searcher will click on my listing which is at the top! So, why should I pay for branded ads?”
This report provides insight into how users interact with paid and organic listings in different circumstances. It allows you to analyse whether it is worth bidding on branded ads, giving you data to answer this question properly.
Another use case for this report is to help you understand which organic keywords perform well that aren’t already in AdWords. You can see whether any top performing organic listings could be used for AdWords and vice-versa. You might find there are a lot of keywords that are performing well in AdWords. The report helps you see whether you are organically ranking for any of those keywords and make those the priorities for your SEO efforts as well. This report ultimately helps us integrate our SEO & SEM efforts.
Next, we will explain how to set up this report, what information you need and where to access it. Further on in the chapter, we will show you how to run the report and interpret the results. The report is quite confusing at first glance, so we will walk you through it.
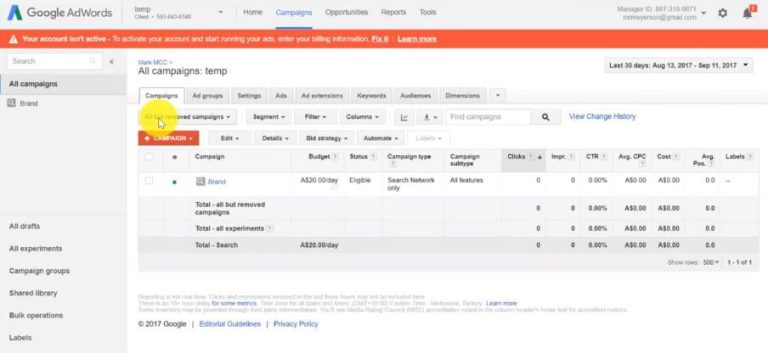
The report is hidden away nicely inside the AdWords interface. Once inside your AdWords account navigate to the Dimensions tab >> in the ‘views’ drop-down menu select ‘Paid and organic’.
This is the report we want. Initially, there will be no data displayed because we first need to connect to the Google Search Console which is where we import the organic search data from.
The easiest way to do this is via the link displayed in the report which you can click. That takes you to the ‘linked accounts’ section. Alternatively, if you don’t see the link, navigate to the cog in the top right-hand corner and select “linked accounts”. This brings you to a new screen where we connect with the Google Search Console.
The Search Console provides data on organic keywords sending traffic to your website – impressions, clicks and click-through rates. We must import it directly from Search Console since this data is not captured by Google Analytics.
If you don’t currently have a Search Console account, then I advise you to set up an account. The setup is beyond the scope of this chapter, but it is highly advisable for anyone that has a website since it provides a wealth of data about website performance.
If you encounter any issues connecting the two products, it is likely an access problem. Before linking AdWords and Search Console, it is essential to ensure you are accessing both products with the same login. If you don’t have access to Search Console with the same login you use to access AdWords, you will need to have an admin provide your email with login access. These two logins must be on the same domain to make the link.

Once you have all the relevant access levels, inside the ‘linked accounts’ settings, type in your domain name. The system will check your access. You will then be prompted to request access to that search console. The system then sends off an email. You now need to log into your search console, inside you will find a message requesting access, which you can grant.
As long as you are the administrator of the search console account and the AdWords account and they are on the same login, this should be a straightforward process. If you run into any issues, chances are it is because of your admin access.
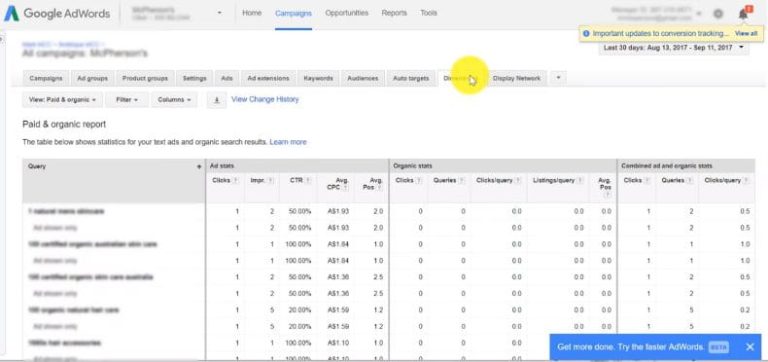
Now that AdWords & Search Console are linked, you still need to wait some time for the report to populate. Unfortunately, it does not retroactively sync the Search Console. Only once the linking takes place will report data be recorded. Moving forward, data will start filtering into your AdWords account, so you will have to wait a few weeks before you can begin to analyse.
Skip ahead 1 month into the future and now we have data! We now want to export the full report to an excel file which can then be used for processing.
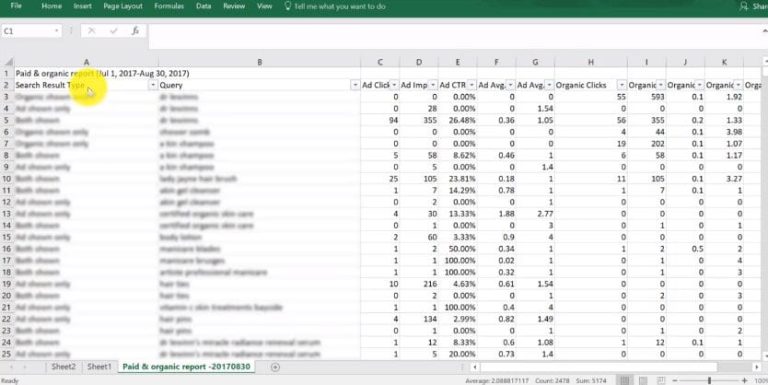
To do this, first navigate to the report and set our date range >> Select the Download button >> download to excel. You should now have an Excel file with the date and the title “Paid and Organic report”.
The first column in the excel file is the ‘search result type’. This column displays whether an ad or an organic listing or both were shown on the SERP. The next column is the query column which shows the actual search term, not the keyword, which is an important distinction. We are not viewing keywords, rather actual search terms typed into Google Search. The remaining columns display your metrics: Clicks, Impressions etc.
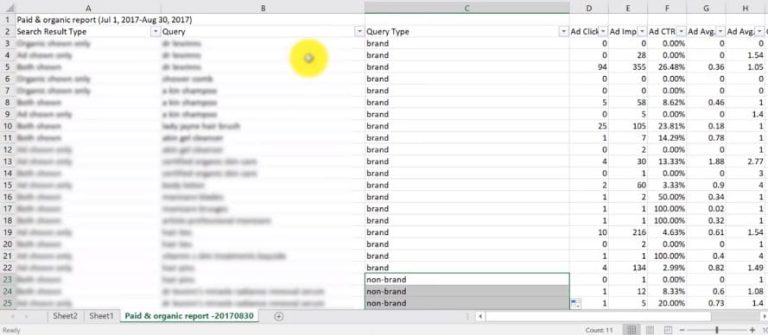
In order to differentiate query types, we will add a new column and call this column ‘Query Type’. Now we add a filter to the table and create a text filter on the ‘Query’ column. In the text filter we will filter for any brand query by writing in our brand name. Let’s assume our brand was Coca Cola, we write ‘Coca Cola’ in here, then filter for any keyword that has Coca Cola in it. After the filter is applied we fill out the blank cells in the ‘Query Type’ column with the word ‘Brand’. All these queries with ‘Coca Cola’ in them are now labelled as ‘brand’ in the ‘Query Type’ Column.
All the remaining queries by definition will be non-branded. This time we create a text filter and select ‘does not contain’. within that filter we enter ‘Coca Cola’ again and click OK. In all the blank cells in the Query Type column, we enter ‘non-brand’. Then we can un-filter the whole table and all our queries will be labelled either ‘Brand’ or ‘Non-brand’.
The next step is to create a pivot table to analyse the data in a meaningful way. Select the whole table and then under the insert menu in Excel, click ‘insert pivot table’. Select the option to insert the pivot table into a new sheet. In the next section, we will manipulate the data to gain insight – finally!
Now that we have created our pivot table on a new tab, we can begin to work with it.
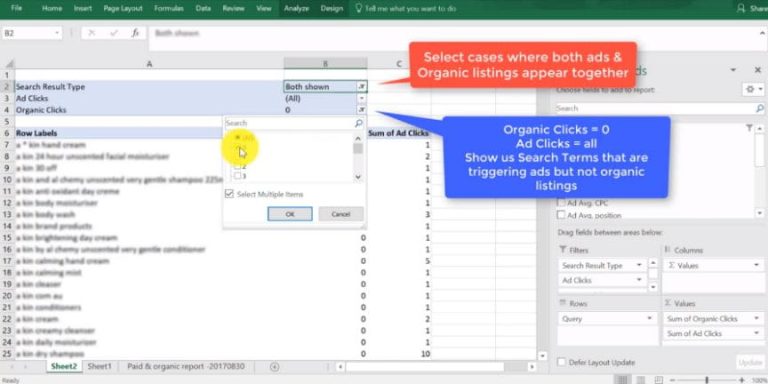
First, set out the pivot table fields according to the below screenshot. In the ‘filters’ section, we add 3 filters. The first is ‘search result type’, which we have opted to show ‘both’, because we want to see what happens when both ads and organic results are shown. Then ‘Organic Clicks’ should be the second value and ‘Ad clicks’ the third in the ‘Filters’ section
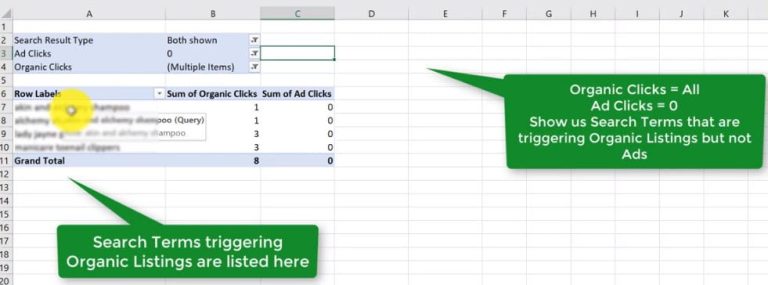
Set the filter ‘Organic Clicks’ to equal ‘0’ and ‘ad clicks’ to ‘all’. We are trying to find cases where an Ad was clicked but an SEO listing was not. These are search terms that are coming through on AdWords but are not getting any organic traffic. looking through all these keywords, if they are receiving clicks and look relevant, you should try to optimize these for SEO.
We can then change the filter, to show results when ad clicks equal 0. These are cases where we received organic clicks and no ads are appearing. As long as these are relevant they present good opportunities to add into the AdWords account
The next report is going to look at the user engagement on the search engine results page when we show AdWords ads with SEO listings. This report is great for answering those questions you get from your clients: “will my Ads do better if I have a branded Ad” or “should I be bidding on brand in general, If I already rank for my brand?”
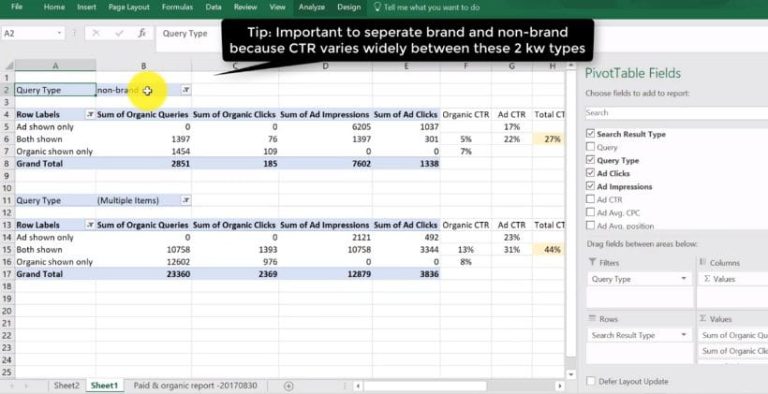
First, adjust the filters field on the pivot table to include only the field ‘query type’. In the values area on the pivot table we will select for four fields, (which are the columns across the top of the pivot table): ‘Sum of Organic Queries’, ‘Sum of Organic Clicks’, ‘Sum of Ad Impressions’ and ‘Sum of Ad Clicks’.
Now that we have our filter in place, we need to set the ‘Query Type filter’ at the top to ‘non-brand’, we want to see what happens when a user uses a non-branded search term. The pivot table displays the sum of the data in each column, which shows how many queries (impressions) and how many clicks there were for Ads and organic listings.
The next step is to make some of our own calculations in the columns to the right of the pivot table. To calculate organic (SEO) CTR, we divide Organic Clicks by Organic Queries. In the example shown above, the CTR is 7%.

We can do the same calculation for Ad CTR, we divide ‘Ad Clicks’ by ‘Ad Impression’, which yields a CTR of 17%. This is when we show ads only on the SERP for non-branded keywords.
The middle column is where it gets interesting and we can see the interaction. We are now looking at what happens when both ads and organic listings are shown on the same SERP. ‘Organic Clicks’ divided by ‘queries’ yields a CTR of 5%. It makes sense that CTR drops for the organic listing slightly when the ad is shown with it, since the ad will take some of the clicks away.

Looking at the opposite effect, on the Ad CTR, when an ad appears by itself it gets a 17% click-through rate, however, when it has an SEO listing below it, it gets an even higher CTR of 22%. This is fascinating because it means people are looking at the Ad, scrolling down a bit more, looking at the SEO listing and then potentially scrolling back up once again and clicking on the Ad, so the CTR is even higher!
Now, if we consider the total CTR (This takes the sum of these two cells, divided by impressions on both SEO and Ads together), meaning, the sum of clicks on both ads and organic listings together, divided by queries, then we get a CTR of 27%
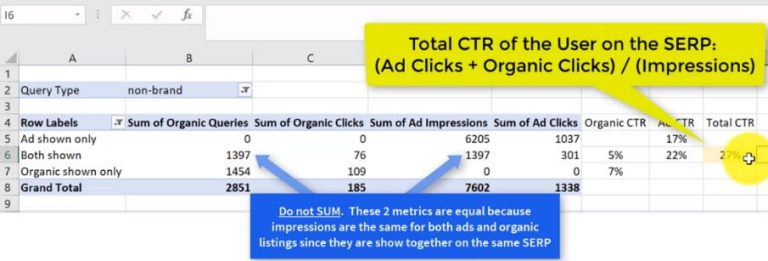
This tells us is that when an Ad and an organic listing are shown together on the page, the overall CTR to one of those listings, (it doesn’t matter which) is going to be 27%. The key point here is that this CTR is greater than the sum of the CTR of the ads and organic. The whole effect is greater then the sum of its parts!
If you notice this effect in your data then this is the aha moment, the time where you can turn back to your client and say that showing Ads and SEO listings together is likely creating a strong reinforcing effect on users. Having 2 listings on the SERP, taking up most of the users’ screen is dominating the SERP.
This reinforcing effect should be even greater when we look at branded searches. To get branded data in the pivot table, we need to change the ‘Query Type’ filter from ‘non-brand’ to ‘brand’ or just select all queries that are non-branded.
We see several interesting things. Firstly, in the pivot table for ‘non-brand’, when we showed an organic listing with an Ad on top, we saw the CTR decreased. But for branded queries in this pivot table, even with an Ad on top, our data shows that the CTR increases even for organic searches. This means that the ad is causing the user to click more on the organic listing. This could be another instance of the reinforcing effect. Once the user is down at the organic listing he is more inclined to click on it since he has seen your brand twice already.
Interestingly as well, when an Ad is shown with an organic listing, even the CTR on the Ad increases for branded queries. In effect this means that a user sees the ad, then scrolls down and sees the SEO listing, then scrolls back up and clicks the ad!
Overall, when the AdWords listing and the SEO listing are shown on the same page, the overall CTR increases massively. In our case it was a huge 44%. Again, this is likely the reinforcement effect coming into play. It becomes especially strong with brand.
When I present this data to my client, I usually remove the pivot table and just keep the 3 columns of calculations.

Clean tidy and very insightful!

Neil Patel recently shared powerful tips on email marketing success—think cleaner lists, smarter personalization, and value-packed content. His key message? Email isn’t dead; it’s evolving.

SEO copywriting: user-focused, keyword-rich content. Optimize URLs, titles, and meta descriptions. Balance search engines and audience needs to boost rankings and drive traffic.

Brand owners can control their Amazon listings and remove unauthorized sellers by enrolling in Brand Registry. This grants priority in content updates, access to A+ content, and tools like Brand Transparency and Project Zero.
Subscribe to receive exclusive industry
insights & updates
Copyright © 2014 – 2025 One Egg. All rights reserved.
Subscribe to receive exclusive industry insights & updates