Prerequisites
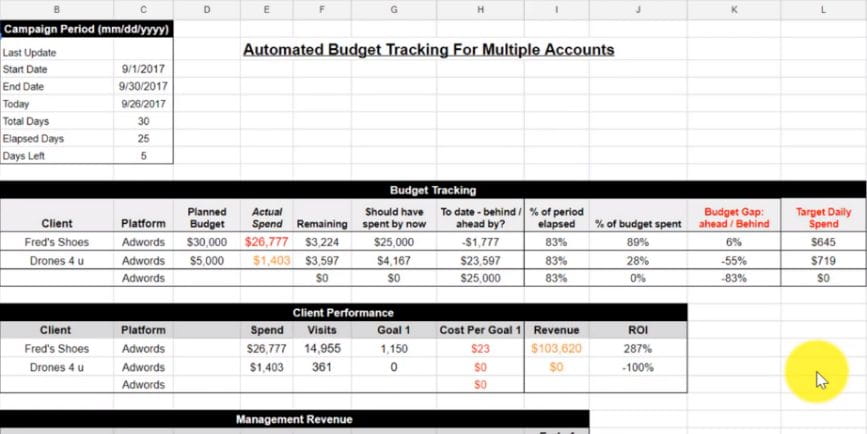
The template I’ve built and which I am giving away to you is essentially a Google Sheet that connects to your Google Analytics account. From there it will pull in your AdWords costs for multiple accounts. You will need access to Google Sheets and also have your AdWords and GA accounts linked up properly.
As long as you are tracking your AdWords traffic (and other sources) via GA the template will work. There are other connectors (like Supermetrics which connects directly to the advertising platform without GA in the middle), however, these are paid products, the GA connector is free.
Overview
You can access the free template here.
In the next section, I will walk you through the setup process, how to use the sheet and how to read the output. The screenshot above shows the output. The idea is that after setting it up one time, with the click of a button you can quickly see your actual spends vs target spends. You can see how far off your budget you are and what you need to adjust your daily campaign spends to in order to get back on track.
The sheet can also import GA goals and give you a snapshot of how many conversions have a been achieved in the time period
Getting started with the input
In order for the sheet to work properly, you will need to be logged into the same Google account that has access to your Google Analytics profile. The Google Doc and analytics should be on the same login.
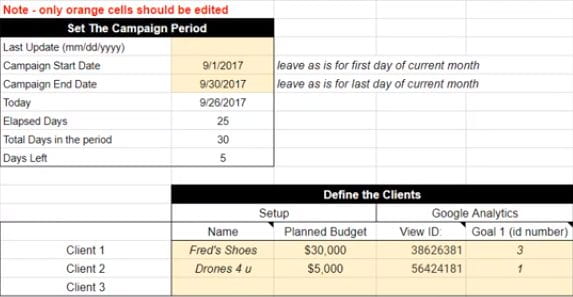
Once you’ve opened the sheet, the first step is to make your own copy. Navigate to File > Make a copy.
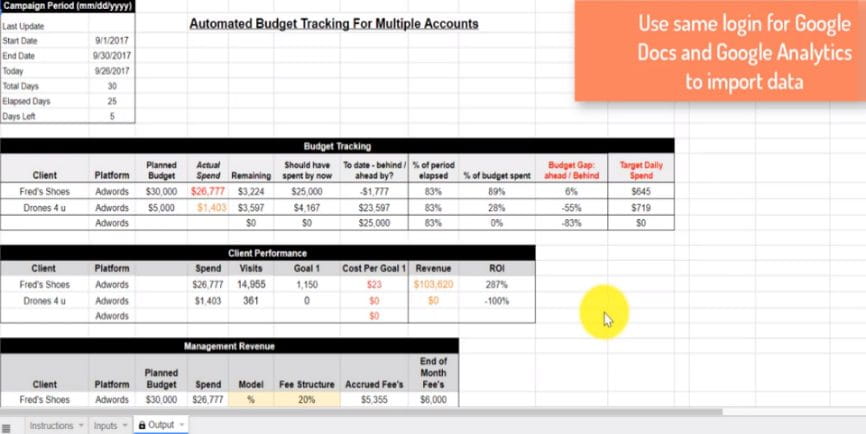
There are three tabs on this spreadsheet. The first tab is the instructions tab. The second tab is for inputting your account details and dates, only orange cells should be adjusted. The third tab is the output of data.
I’ve written out the process in an easy step by step guide below:
Step 1: Ensure that your AdWords and Google Analytics accounts are linked, as this tool reports the data through Google Analytics. This support article from Google outlines how to do this.
Step 2: Ensure you’re logged into the same Google account on which you have access to GA.
Step 3: In the sheet, navigate to File > ‘Make a copy’ of this spreadsheet for yourself.
Step 4: Install the Google Analytics spreadsheet add-on. It can be found in the add-ons menu in Google Sheets. Add-ons > Get Add-ons > search for ‘Google Analytics’ > install the first listing.
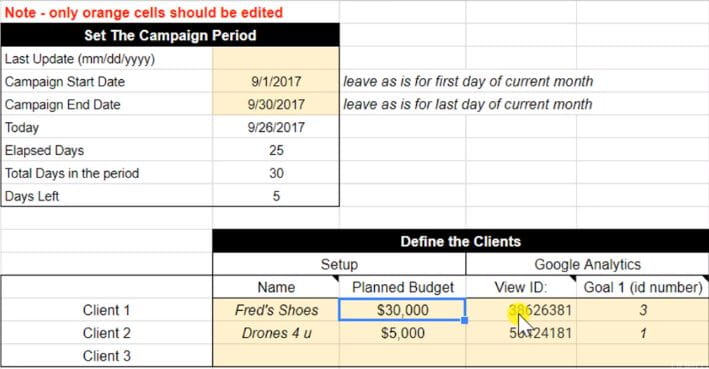
Step 5: On the inputs tab, set your date range. As a default, the date range is using a formula for the start date as the first day of the current month and end date as the last day of the current month. This suits anyone who is setting budgets monthly. You can change this by entering your own dates in these light orange cells C4 & C5.
Step 6: Add a client’s name & budget in the orange cells in the next table down. I have called this client ‘Fred’s Shoes’. My planned budget for the month of September for Fred’s Shoes is $30,000. Replace these items with your own clients details
Step 7: Add the GA ‘view ID’ for that client. This can be retrieved from Fred’s Shoes Google Analytics profile. Navigate to Google Analytics > Admin section.

Then select ‘View Settings’. This will provide you with the view ID that you need to add into your spreadsheet.
Step 8: (optional). At this point while in GA, the next item under ‘View Settings’ is goals. If you have setup tracking goals in your GA account for your client then you can also add the goal ID that you want to track goals for within the spreadsheet. This makes the sheet more than just a budget tracker but also a goal tracker.
Step 9: Repeat steps 6 to 8 for the next clients, on the subsequent rows of the spreadsheet. At the moment this is filled out as ‘Drones 4 U’.
The setup is now complete!
Analyzing your dashboard
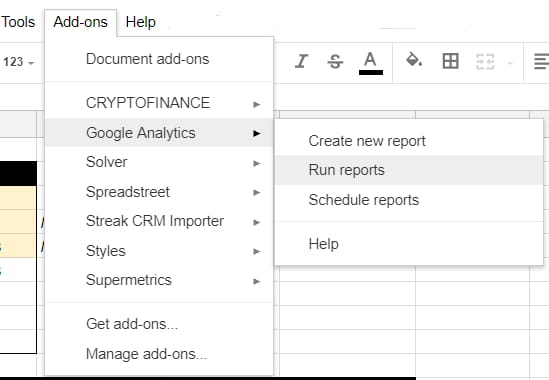
We’re now moving over to the output tab. The first thing to do is to refresh the tab. Navigate to add-ons > Google Analytics > Run reports. This will pull in the data from GA.
If you haven’t added a goal ID, you might see some errors pop up. You can ignore these.
Looking at the output. The top table shows the date ranges we have set and a calculation for the remaining days in the period we have set. This is default set as a month, but it can be updated via the input tab to a different time period to suit your clients budgeting specifics.
Budget Tracking Table
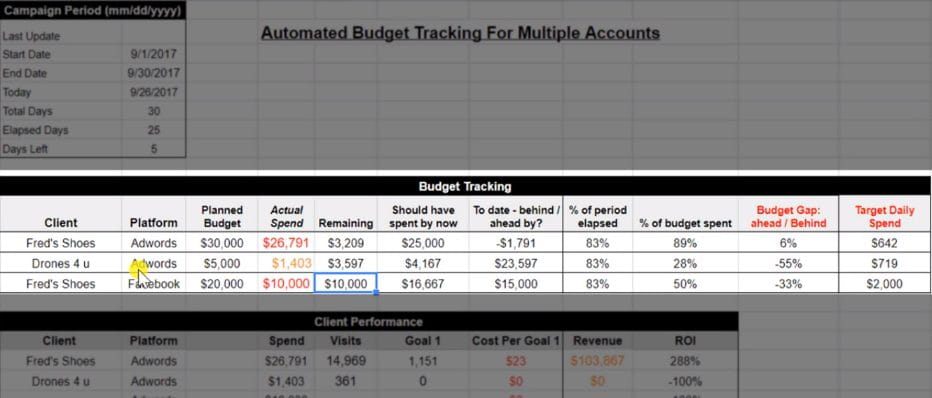
The second table is the budget tracking table.

In the example above, the budget is displayed in column D, from the input tab as $30,000. The Actual Spend (Column E) is pulled in from GA. We can see that Fred’s Shoes has spent $6,338. I can see that I have $23,662 remaining in this time period (column F). Column G & H tell me what I should have spent by now to be on track for my budget and how far behind I am from where I should be.
Looking at column I & J, the table breaks this down to %’s and tells me that we are 71% way through the month and we have only spent 21% of the budget. Column K shows that I am 50% behind where I should be.
Column L is the most useful in that it tells me I should be spending $2,629 / day in order to close out the month spending the full budget allocation.
Actionable Insights
In reality, I mostly look at column K & L, that’s why they are written in red. Column L is extremely actionable. Now I can jump back into AdWords and adjust my daily budgets to that number.
Within AdWords, navigate to the campaign view of all campaigns. I set the graph to look at daily cost.

I look back at the last few days as to how much we have spent on average per day and make adjustments to reach that difference.
For example, in the above graph I can see that we spent about $1,300 / day at the campaign level of the whole account. I need to adjust this upwards to $2,629 (from my sheet). I need to add an extra $1,329 per day to my campaigns.
My next step is to go through my campaigns and allocate that extra $1,329 to the campaigns based on performance. This is extremely effective, reviewing this sheet at least once a week is an easy way to keep budgets on track for multiple campaigns. The sheet provides you the number, so you don’t even have to think.
Adding data Manually
In a case where you cannot connect to your clients GA account, you can always add in the ‘actual spend’ manually after looking it up in the platform. You might find that there are some ad platforms like AdRoll or Quora where you cannot import the spend data, even via supermetrics.
In the schreenshot to the right I’ve added Facebook as a platform manually and input my budgets. Even though this is a manual process, there is still value in having all of your budgets in a central location. The spreadsheet calculations will also still work, so at least you can quickly calculate your daily spend requirements for all your platforms.
Tracking Performance
The next table on the sheet, is for tracking ‘Client Performance’.
This table will work if you have goal tracking setup in GA and you have added your Goal ID’s from GA on the input tab

For Fred’s shoes we can see that there were 211 ‘Goal 1’s’ and a “Cost per Goal 1’ of $30.
Furthermore, if you have revenue tracking setup in your GA profile the sheet will automatically import it. We can see revenue for Fred’s shoes was $21,557 for this period.
This way, you can get a quick snapshot of spend, goals, and revenue across all the accounts that you have added in for budgeting.
Management Revenue for Agencies
The last table, ‘Management Revenue’ is optional. I’ve added it for those of you who might be running an agency and using different fee structures for different clients. Based off these fee structures you can predict what your revenue will be for the current month.

As an example, I charge Fred’s Shoes 20% of their AdWords spend in fees. I can see that my fees at the end of the month are going to be $6,000. However, I have only accrued $1,268 so far because I have only spent $6,338.
Drones 4 U on the other hand has a fixed model. My fees are going to be $500.
I’m sure you have your own ways of tracking management revenue, but the idea here was a way to see what current revenue is and what will happen if clients do not realise their full budgets.
I am giving away this tool for free. Let me know how it works for you. If you get stuck, there might be a few bugs still in it, but I will be happy to walk you through it.


